
Quick Question: What’s this all about? Is this just the “Which way does the water go down the drain” thing?
Not all science at the South Pole gets to be really flashy camera-worthy stuff. Some of it requires, time, patience and lots of data collection. For the past couple of weeks, folks in the galley have been helping us collect Science data on whether we can detect a significant Coriolis effect here at the pole.
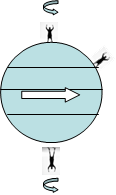
The Coriolis Effect – a quick refresher
We all know that a skater spinning on her skates will spin faster if she pulls her arms in closer to her axis of rotation, right? (Those of us who are lazy can do it in office chairs, too). This is due to conservation of angular momentum: if you take something that’s spinning and move its mass closer to the center, it’ll spin faster.
The same thing works with water, too. If you take some water that’s spinning and draw it into the center of its rotation, for example pulling it down the drain, it’ll speed up. That’s what gives us those pretty whirlpools in the tub.
News flash: down here, we’re all spinning. Standing at the South Pole, we’re all going around at 1/1440 rpm (or, one revolution per day, clockwise, if you look down at the ground). So if we pulled our arms in close, we ought to spin around faster, right?
Well yes, in theory. But the effect is so small that we can’t really feel it. It is strong enough, though that if you took a perfectly still tub of water and started draining it, the teeny tiny effect of the Coriolis force as it got pulled to the center would nudge it to start spinning clockwise.
So in a perfect world, water in the Southern hemisphere would always drain clockwise [It’s important to realize that what direction you’re spinning depends on latitude. Relative to the axis of the earth, folks at the North Pole are spinning counterclockwise, and folks on the equator aren’t spinning at all.]
But it’s not a perfect world – the water’s already swirling around on its own, and the Coriolis effect is so weak that whatever motion’s already going on in the water tends to overwhelm it.
So – how can we still try to observe the Coriolis effect? Statistics!
The Experiment
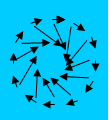
We can hypothesize that the swirling motion of the water is random, and is just as likely to lead to a left-spiraling drain as a right spiraling drain. If this is true, then without the Coriolis effect, we’d have – on average – about as many clockwise swirls as counterclockwise swirls.
With the Coriolis effect, we expect the results to be pushed slightly in the direction of clockwise swirls. Just as when flipping an imperfectly balanced coin, with enough repetitions we ought to start seeing a pattern – in this case, a statistically-significant difference between the number of clockwise and counterclockwise spirals.
Rickey, Rachael and Kasia spend a lot of time in the Station dish pit, washing all the stuff we use at each meal. There are three big sinks in the dish pit (wash, rinse and bleach), and when the water in them gets dirty, they get drained and refilled. The experiment itself was simple: R, R & K volunteered to keep track of which way the water flowed when they drained.
But before we go out and alert the newspapers, we’ve got to pause for a minute and think about some things.
What’s wrong with this experiment?
Lots of things.
First of all, we have no way to test our hypothesis that the initial conditions are random. The drains may be constructed in a way that favors water swirling one way or another. And individual dishwashers may tend to swirl the water in one way or another. The real scientific thing to do would be to transport the dishpit (and dishwashers!) to the Northern hemisphere to repeat the experiment.
A second – and more serious – problem is the observational one. In the name of getting folks to participate, we’re explaining up front what results we’re expecting, and thus introducing the very real chance of bias. It’s really hard to not notice results that tend to confirm your hypothesis and ignore results that tend to contradict it.
If we were really serious about this, we’d keep everyone in the dark about the purpose of our experiment, or develop and install automatic “swirl-o-meters” to take humans out of the loop. But that wouldn’t be nearly as much fun, so we’re risking scientific integrity in the name of participation.
The Results
Over the past week or so we collected N observations – 15 clockwise, 9 counter clockwise. That’s 62% clockwise, in favor of the hypothesis. So the hypothesis is right, right? Wrong.
The Analysis
That’s the thing about statistics, and science in general. Only in rare cases can you prove a hypothesis. You can often disprove it, but almost never prove it – there can always be alternate explanations. As we observed above, the drains might be designed to prefer a clockwise swirl. The predominance of right-handed dishwashers at the pole might be a factor. It could be anything.
With statistics, the problem is even more pronounced. Since there’s a big element of randomness in this experiment, it’s possible that we’d get this many clockwise swirls by sheer chance, even if there were no Coriolis effect. And even if the Coriolis effect tended to swirl water in the other direction!
So what do we do about this? We compute probabilities. Let’s say there was no experimental bias, and no Coriolis effect. What would be the probability that we’d get at least this many clockwise swirls? The math is pretty straightforward, but requires juggling some big numbers – what we need to do is pretend we’re flipping a fair coin 24 times, and count up the number of different ways it could come up heads and tails (e.g. heads the first and third time, and tails all the other times, vs …). We then count up the number of those permutations in which there were 15 or more heads. The big numbers come because when you flip a coin 24 times, there are over 16 million possible outcomes (2^24 = 16,777,216)
Fortunately, some clever statisticians have reduced this whole “counting” thing to a function called the binomial distribution: you plug in N, how many total trials you’ve got, and p, how “fair” your coin is (the probability of “heads”; p = 0.5 for a “fair” coin). The binomial distribution will then tell you how likely it is that you’ll see any given number of “heads” with this many flips. Very convenient.
In our case, our null hypothesis is that there’s no effect, and that the drain will equally swirl clockwise and counterclockwise, so p = 0.5. With N = 24, out binomial distribution looks like this.
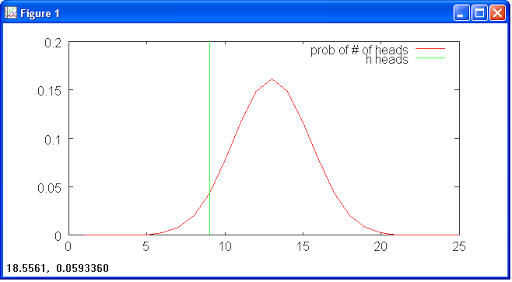 |
| Not tons of statistical confidence with just 24 trials. The area under the curve to the left of the green line is the probability that we’d see our observed results just by chance. |
Even if there is no effect, we could expect to see this kind of skew 15% of the time (15% of the area under the curve is over to the left of the line). So our experiment doesn’t have a huge amount of statistical significance: we should see this kind of skew by pure chance around one time every six. Bummer.
What do we need for statistical significance? Mostly more trials. If we were to double the number of observations up to 48 *and* we still observed the same proportion of clockwise to counterclockwise swirls, we could plug those numbers into the binomial distribution and calculate that we’d only see that kind of skew from a “fair” coin 5% of the time. It’s still not “proof”, but we’d have 95% confidence that there was some kind of bias in the system. Again, we can’t pin it on the Coriolis force – all we can do is different kinds of experiments to try to rule out other explanations we’ve thought of.
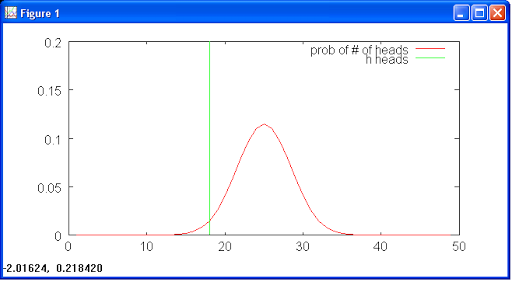 |
| With 48 trials (if we had the same proportion of clock/counterclock swirls) we’d have much higher statistical confidence. |
Yeah – not quite as exciting as clouds of water vaporizing in a big “whoooosh”, or playing ping pong with frozen soap bubbles, but well, there’s science, and then there’s Science.

This comment has been removed by the author.
LikeLike
Very interesting. We glider pilots debate whether we should turn left or right when we hit a thermal. Some say that we should always turn right because thermals are rotating counter-lockwise and we want to take advantage of the increased relative airspeed. I'm looking forward to seeing the result of your further experiment.
LikeLike
Such a great article which The same thing works with water, too. If you take some water that’s spinning and draw it into the center of its rotation, for example pulling it down the drain, it’ll speed up. That’s what gives us those pretty whirlpools in the tub.Thanks for sharing this article.
LikeLike
Nice post which With the Coriolis effect, we expect the results to be pushed slightly in the direction of clockwise swirls. Just as when flipping an imperfectly balanced coin, with enough repetitions we ought to start seeing a pattern – in this case, a statistically-significant difference between the number of clockwise and counterclockwise spirals. Thanks a lot for posting.
LikeLike